Applying sentiment analysis with VADER and the Twitter API
A few months ago, I posted a blog post about a small project I did where I analysed how people felt about the New Year’s resolutions they post on Twitter. In this post, we’ll go through the under-the-hood details of how I carried out this analysis, as well as some of the issues I encountered that are pretty typical of a text mining project.
If you’re interested in getting a bit more detail on the package I used to do the sentiment analysis, VADER, you can see this in last week’s blog post. If not, let’s jump straight into it!
Setting up your app
To do this analysis, I pulled data from Twitter’s public search API, which allows you to pull historical results from up to a week ago. To get started, you will need to create a Twitter account (if you don’t already have one), and then jump over to Twitter’s application management portal. If you’ve never done this before, what we are doing here is creating a unique ‘identity’ that will allow Twitter to work out who we are when we’re accessing their public API. This is a way for them to boot off users or apps that are using the API too heavily or doing dodgy stuff like spamming the site.
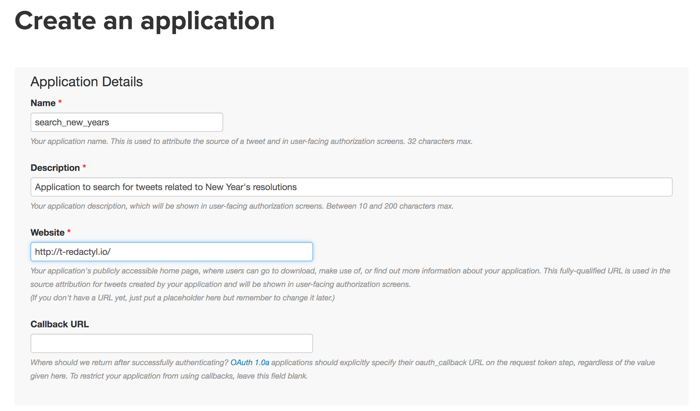
Once in there, hit the ‘Create New App’ button, and you’ll be prompted to enter a name, description and website for your app. It doesn’t really matter what you write in here - just make sure that the name is not so generic that you can distinguish one app from another.

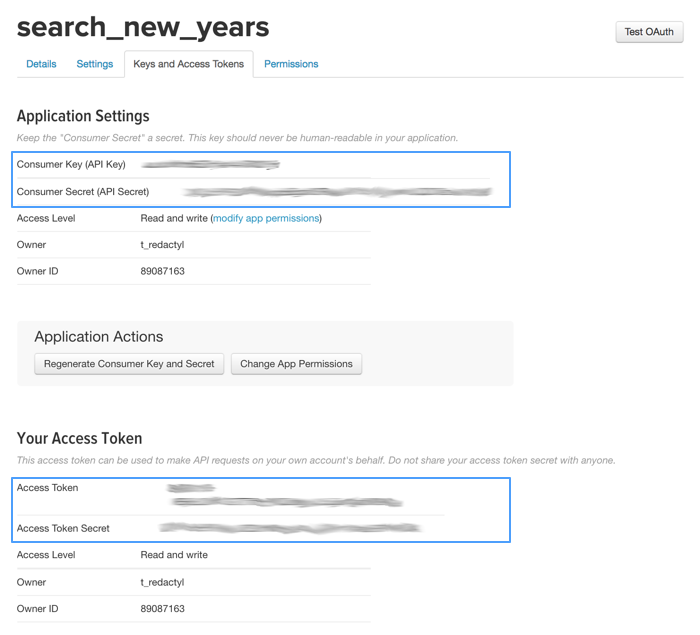
Once you’ve done that, you’ll want to jump into the ‘Keys and Access Tokens’ tab. There are 4 bits of information we need to get from here so that our Python program can connect to the API. We need the consumer key and the consumer secret (circled at the top of the below screenshot), and also the access token and the access token secret (circled at the bottom). As you can see I have blurred mine out - you should take care to keep these secure and not do something like commit them to a public Github repo or anything (definitely not something I’ve done in the past…).

Pulling down some data
Now that we have our keys, we can connect to the API and pull down some data. In order to do this, we first need to install and import the tweepy and json packages:
import tweepy
import json
Let’s now take those keys that we got from the app and use them to set up the connection to the API. As you can see below, we need to pass these keys to the authorisation handler and then get the API method from tweepy to use them. We also need to get tweepy to return the results as JSON.
# Enter authorisations
consumer_key = "XXX"
consumer_secret = "XXX"
access_key = "XXX"
access_secret = "XXX"

# Set up your authorisations
auth = tweepy.OAuthHandler(consumer_key, consumer_secret)
auth.set_access_token(access_key, access_secret)

# Set up API call
api = tweepy.API(auth, parser = tweepy.parsers.JSONParser())
Now that we’ve done that, let’s define our search. We need to restrict our search to the exact phrase “new year’s resolution”, and we also want to get rid of retweets (because they are essentially just duplicates in this dataset). The full list of possible ways to search are in the search API documentation, and they are surprisingly flexible - in fact you can even search on sentiment in your query!
# Set search query
searchquery = '"new years resolution" -filter:retweets'
We can now make our call to the API. You can see here I’ve limited my search to both my specific query terms and also English-language results. I’m also limiting the search to 100 tweets, which is the maximum you can return in a single call (we’ll get to how we get some more volume soon).
data = api.search(q = searchquery, count = 100, lang = 'en', result_type = 'mixed')
Let’s have a look at these data, which are in JSON format. For those of you who haven’t worked with JSON before, in order to get our data out we just need to find how to reference it properly in the structure, which is a series of nested Python lists and dictionaries. (I’ve written in more detail on how to work your way through a JSON file here). In our case, all of the data about each tweet is contained in a dictionary. Each dictionary is contained in a list, and this list is contained at index 1 of an overarching list. Thus the below code returns the tweet text for tweet number 12 in our dataset:
data.values()[1][12]['text']
u'my new years resolution is to be even more bitter than before'
Getting some volume
Now that we’ve returned our first 100 tweets, we need to scale up to get enough tweets to actually analyse. In this case, I’ve arbitrarily decided on 20,000 tweets, but you can get as many as you like. In order to do this, we need to put our original API call into a loop. However, we need each loop to start after the final tweet returned by the previous call. To do this, we extract the ID of the last tweet from each call and add this to the max_id argument in the api.search() method.
In order to make sure we’re not exceeding the number of API calls we can make, we can rate-limit our calls using the sleep() method from the time package. You can see I’ve put 5 seconds between calls.
Finally, you can see I’ve stripped the results out of that outer list, and appended them to a list called data_all. We’ll use this list as the basis of our DataFrame in the next step.
import time

data = api.search(q = searchquery, count = 100, lang = 'en', result_type = 'mixed')
data_all = data.values()[1]

while (len(data_all) <= 20000):
    time.sleep(5)
    last = data_all[-1]['id']
    data = api.search(q = searchquery, count = 100, lang = 'en', result_type = 'mixed', max_id = last)
    data_all += data.values()[1][1:]
Putting it in a DataFrame
We now have a list of up to 20,000 dictionaries containing all of the metadata about each tweet (I say up to, as your particular query may not have enough matches from the past week). We now want to pull out specific information about each tweet, as well as generate our sentiment metrics.
For my particular analysis, I used the tweet text and the number of favourites each tweet received, but feel free to play and explore the huge amount of metadata you get back about each tweet for your own purposes - it’s honestly a bit creepy how much data you can readily access!
Another thing I am going to do at this step is to generate the sentiment scores for each tweet. As we saw in the last post, the polarity_scores() method from VADER generates all 4 of these for a piece of text. All we need to do is to run this method over each tweet, and select one sentiment metric at a time. This will be a bit clearer in the code below.
The first thing we need to do is create separate lists for each piece of information we want to get from the JSON files. These will be the basis for columns in our DataFrame.
tweet = []
number_favourites = []
vs_compound = []
vs_pos = []
vs_neu = []
vs_neg = []
We now need to loop over every tweet, extract the relevant information, and append it to its specific list. You can see that for the sentiment metrics, we are taking that additional step mentioned above of passing the tweet text through the polarity_scores() method and keeping only, for example, the ‘compound’ metric for the ‘compound’ list.
from vaderSentiment.vaderSentiment import SentimentIntensityAnalyzer
analyzer = SentimentIntensityAnalyzer()

for i in range(0, len(data_all)):
    tweet.append(data_all[i]['text'])
    number_favourites.append(data_all[i]['favorite_count'])
    vs_compound.append(analyzer.polarity_scores(data_all[i]['text'])['compound'])
    vs_pos.append(analyzer.polarity_scores(data_all[i]['text'])['pos'])
    vs_neu.append(analyzer.polarity_scores(data_all[i]['text'])['neu'])
    vs_neg.append(analyzer.polarity_scores(data_all[i]['text'])['neg'])
Finally, we assign each list as a value in a dictionary, and make the key what we want the column to be called in our DataFrame. We pass this dictionary to the pandas DataFrame function, and then rearrange the columns to get our final, ready-to-use DataFrame!
from pandas import Series, DataFrame

twitter_df = DataFrame({'Tweet': tweet,
                        'Favourites': number_favourites,
                        'Compound': vs_compound,
                        'Positive': vs_pos,
                        'Neutral': vs_neu,
                        'Negative': vs_neg})
twitter_df = twitter_df[['Tweet', 'Favourites', 'Compound',
                         'Positive', 'Neutral', 'Negative']]

# Have a look at the top 5 results.
twitter_df.head()
| Tweet | Favourites | Compound | Positive | Neutral | Negative | |
|---|---|---|---|---|---|---|
| 0 | I’ve fulfilled my New Years resolution! @Maple… | 89 | 0.4753 | 0.205 | 0.795 | 0.000 |
| 1 | My New Years resolution was to travel and go o… | 1 | 0.0000 | 0.000 | 1.000 | 0.000 |
| 2 | i stopped being petty a long time ago shit was… | 0 | 0.2846 | 0.146 | 0.679 | 0.175 |
| 3 | Is it to late to make a New Years resolution? | 1 | 0.0000 | 0.000 | 1.000 | 0.000 |
| 4 | time to restart my new years resolution #NoFuc… | 0 | 0.0000 | 0.000 | 1.000 | 0.000 |
Categorising our tweets
I decided to make this analysis a little more interesting by categorising the tweets into the type of resolution they represent. I based this on the, ahem, very scientific method of checking a Wikipedia article on the most popular types of resolutions, and came up with 6 categories from this: physical health, learning and career, mental wellbeing, finances, relationships and travel and holidays. To get tweets into these categories, I did the very quick-and-dirty approach of thinking of every word I could that was associated with those categories, and then used a regex to search for those terms in the tweet. I’ve put the code I used to identify physical health resolutions below as an example; however, in the interest of not cluttering up this post with reams of code, I’ve put the full code with all of the classifications in this gist.
import numpy as np
import re

twitter_df['Physical Health'] = np.where(twitter_df['Tweet'].str.contains('(?:^|\W)(weight|fit|exercise|gym|muscle|health|water|smoking|alcohol|drinking|walk|run|swim)(?:$|\W)',
    flags = re.IGNORECASE), 1, 0)

# Have a look at the matches for the physical health keywords.
twitter_df[twitter_df['Physical Health'] == 1].head()
| Tweet | Favourites | Compound | Positive | Neutral | Negative | Physical Health | |
|---|---|---|---|---|---|---|---|
| 7 | My New Years resolution was to quit drinking s… | 0 | 0.1384 | 0.11 | 0.802 | 0.088 | 1 |
| 16 | My New Years resolution of going to gym hasnt … | 1 | 0.0000 | 0.00 | 1.000 | 0.000 | 1 |
| 17 | Are you getting PAID to lose weight this New Y… | 0 | -0.4696 | 0.00 | 0.847 | 0.153 | 1 |
| 19 | Are you getting PAID to lose weight this New Y… | 1 | -0.4696 | 0.00 | 0.847 | 0.153 | 1 |
| 83 | What is your new years resolution?? mine is le… | 2 | 0.0000 | 0.00 | 1.000 | 0.000 | 1 |
In a continuation of this very blunt approach, tweets that fell into multiple categories were deleted. Using this approach, 5,125 of the 20,000 tweets were classified into one of the 6 categories.
As you can see, this is a very quick and dirty analysis and comes with a few limitations. I’ll discuss these at the end of this post.
Doing the analyses
In the original blog post, I answered three questions about the data: what are the most popular resolutions, how do people feel about their resolutions, and how do people’s friends feel about their resolutions? A full confession here - although I really like yhat’s port of ggplot to Python, it is still in development and didn’t quite produce the graphs I wanted for this analysis. As such, I jumped over to R to produce the graphs you can see in the original blog post. You can find the code for these in this gist, although there is no reason you can’t adapt this to fit within Python’s ggplot or matplotlib, or of course any of the dynamic graphing packages - just my personal preference!
Some issues with this analysis
As this was a pretty quick-and-dirty analysis, there were a number of issues I found that mean the conclusions I drew from the analysis are probably not entirely correct.
Tweets about other people’s resolutions
The first I found because I was wondering why the resolutions for physical health were so negatively-toned. Surely people can’t feel that bad about getting fit, right? Well, when I started looking at the raw tweets themselves, I found the expected tweets about starting a new fitness plan, which didn’t look very negative at all (this tweet, in fact, has a compound score of 0):

However, then I started seeing all of these tweets where people were bitching about people making New Year’s resolutions about going to the gym:

Digging further, I then found tweets where people were angry at those people making fun of people going to the gym for their New Year’s resolutions!

Unsurprisingly, these latter two tweets were negatively-toned, and these tweets-about-resolutions may be a driver of the low overall sentiment score for physical health resolutions.
So many ads!
Twitter is also chock full of ads, and a lot of companies see New Year’s resolutions as a prime marketing opportunity (especially gyms and weight-loss programs). My search was pretty simple and picked up everything matching the exact phrase ‘New Year’s resolution’, and I estimate probably about one-third of the tweets in the dataset were ads. As most of these are likely to be neutrally-toned, they are adding unnecessary noise to the analysis. As cleaning up these and the tweets-about-resolutions is not straightforward, a bit of thought would need to be given to getting rid of this garbage in order to get the most out of these data.

Misclassified resolutions
As I commented earlier, my approach to classifying the tweets into the types of resolutions was pretty blunt. One problem, of course, is that I’ve likely missed terms that are associated with the resolutions (and I probably have, given that I only categorised about a quarter of all of the tweets!). A bigger problem is that I’ve classified tweets that have nothing to do with the topic of interest. Take, for example, this tweet that fell into the physical health category:

Obviously this is kind of the opposite of what we’re trying to capture. A more sophisticated classification approach, such as topic modelling, could be tried out to see if we can do a better job.
